- PRODUCTS
- MODEL LIST
- APPLICATIONS
- SUPPORT
- SALES/SERVICE
- BLOG
- ABOUT
Accuracy and Stability of Argo SBE 41 and SBE 41CP CTD Conductivity and Temperature Sensors
The functionality on this page was blocked because content blocking is enabled.
Please use another browser to access the form. We recommend Google Chrome. [Learn More]
Carol Janzen, Nordeen Larson, Rick Beed, Kristi Anson, Sea-Bird Electronics, Inc.
December 09, 2008 - Version 1

Summary
Two Argo CTDs, an SBE 41 and 41continuous profiler (cp), were routinely calibrated over 5+ years in the Sea-Bird Alace float facility.- Results indicate a very stable calibration system and low drift performance of the SBE 41 and 41cp designs.
- Results indicate very low drift (< -0.003 psu and -0.002 °C) and sustained calibration accuracy for deployment periods spanning 2 - 6 years.
- A high level of initial accuracy in Argo TS data sets, with tight bounds for sustained accuracy.
- A bi-modal sensor behavior: acceptable as is (accurate, negligible drift) and compromised (broken or sensor performance leading to drift).
- QA/QC of Argo data may best be able to exploit the bi-modal behavior, rather than assigning a continuum of drift/error on all sensors.
References
Dana Swift, Univ. of Washington, School of Oceanography. Personal Communications regarding Argo CTD SBE 41-0933, November 20, 2008.
Acknowledgements
Use of calibration data from recovered Argo floats courtesy of Univ. of Washington (SBE 41-0933, 1924, 1131, 1507); NOAA PMEL as a member of the U.S. Argo Float Consortium, which is funded under the National Oceanographic Partnership Program (NOPP) (SBE 41-1299); JAMSTEC (SBE 41-0846).
Calibration Bath Stability Better than ±0.005 psu and ±0.002 °C
- Errors in the transfer standard and AutoSal, and inhomogeneity in the calibration bath, combined, limit accuracy to ±0.002 psu.
- Sea-Bird calibrates Argo CTDs against temperature transfer standards traceable to Sea-Bird's primary temperature standard, accurate to better than 0.0005 °C at the triple point of water (TPW) and at the gallium melt point (GMP).
- Interpolation accuracy of Sea-Bird's primary temperature standard between TPW and GMP is better than 0.001 °C.
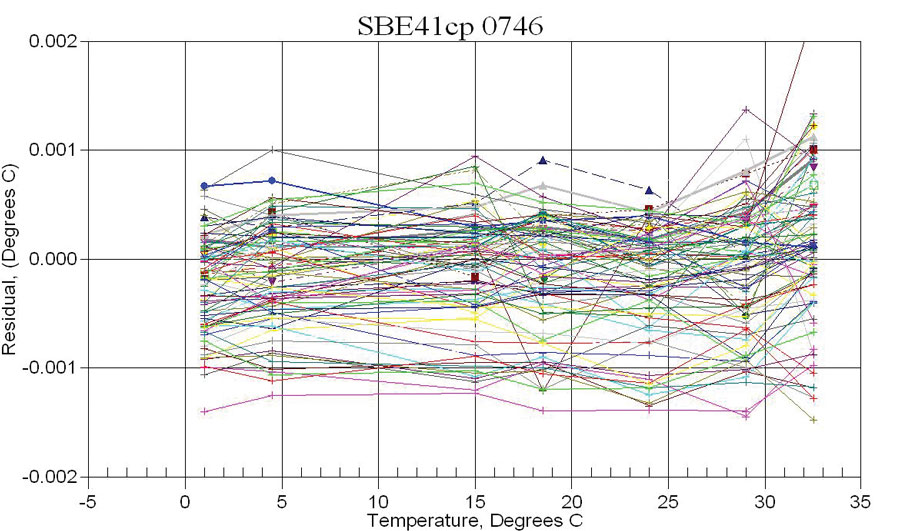
- Cumulative error from transfer standards and the calibration environment is within ±0.001 °C, revealed in repeat calibrations of CTDs using multiple transfer standards in multiple calibration baths over multiple years (see plots).
Expected Performance Issues of Argo CTD Sensors
- Argo floats and CTDs are intended to operate autonomously without maintenance and calibration for 5+ years.
- Half the drift experienced by temperature sensors is expected to occur in years 1 and 2 and is electronic rather than fouling-induced.
- If drift occurs in conductivity measurements, the dominant mechanism is fouling by coatings on the interior cell wall.
- Fouling prevention of Argo CTDs is multi-tiered:
- Plumbed sensors are removed from continual exposure to the fouling environment.
- In-line antifoulant is diffused into trapped water inside the plumbing between profiles.
- Disabling the pump, hence flow through the cell, at 3 dbar prevents ingesting surface oils as the float breaches sea surface.
Table 1. Historical summary for 6 returned floats. Returned CTDs were calibrated "as-is" without cleaning, repair, or alteration. Annual drift rates are estimated solely by number of years between calibrations, and do not consider time at sea or any damage that may have occurred during recovery, beaching, and exposure.
| Argo CTD SBE 41 Serial No. Float No. | Owner | Reason for Recovery | Calibration Dates | Years between Calibrations | Time at Sea | Profiles Executed | Maximum ΔTempper year (°C) | Maximum ΔSalinity per year (psu) |
| 0846 WMO 5900313 | JAMSTEC | Ran aground, Fisherman recovered, Philippines | 09/02 - 10/08 | 6 | 36 months (3 yrs) | > 70 | -0.0003 | -0.0004 |
| 1299 WMO 3900232 | NOAA-PMEL | Fisherman recovered, Costa Rica | 12/03 - 02/08 | 4.17 | 42 months (3.5 yrs) | 120 | -0.0005 | -0.0001 |
| 0933 WMO 1900169* | Univ. of Washington | Fisherman recovered, Indian Ocean, Sri Lanka | 01/03 - 11/07 | 4.92 | ≈12 months (1 yr) | ≈15 | -0.0002 | +0.003 * |
| 1131cp WMO 5900963 | Univ. of Washington | In-situ recovery, Pacific Ocean | 03/05 - 07/08 | 3.4 | 36 months (3 yrs) | 207 | -0.00002 | 0 |
| 1507cp WMO 5901073 | Univ. of Washington | In-situ recovery, Hawaii | 01/06 - 04/08 | 2.25 | 21 months (1.75 yrs) | 124 | -0.0003 | -0.0015 |
| 1924 WMO 6900120 | Univ. of Washington | Ran aground, Greece | 10/04 - 02/07 | 2.33 | X | X | -0.0004 | -0.0004 |
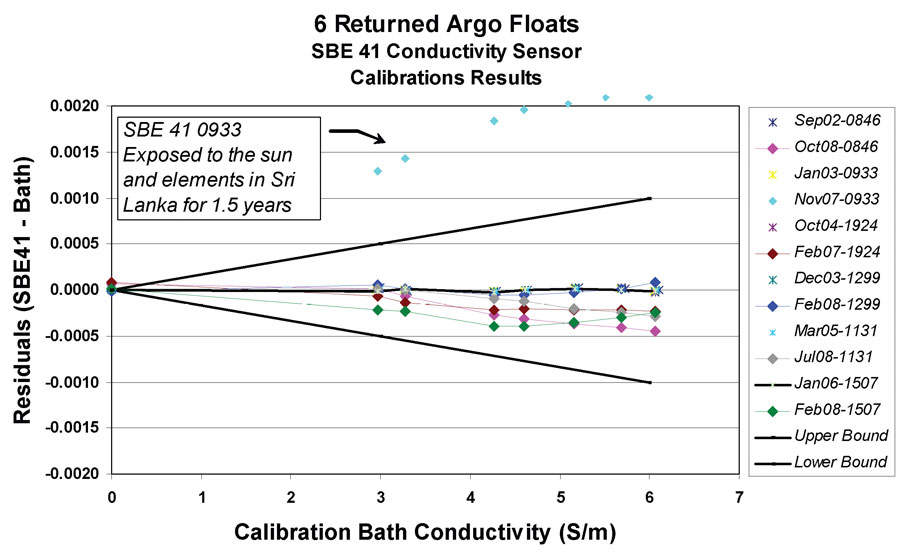
*WMO 1900169 experienced a pressure sensor malfunction after 10 profiles, and ceased descending to its normal park depth (1000m). It floated on the surface for 9 months before being picked up by a fisherman. It sat in port, in the sun, for 1+ year (personal communication, Dana Swift, Univ. of Washington).
Laboratory SBE 41cp and 41 Results -- Salinity Stability < 0.005 psu and Temperature Stability < 0.002 °C
- Drift in conductivity is the proportionate error in the reading -- a sloped line through 0 in the plot. A proportionate error in conductivity is close to a constant error in salinity.
- Conductivity calibrations agree to better than 0.001 S/m, translating to salinity stability of 0.005 psu or less across the range of oceanic conductivities (Figures 2 and 4).
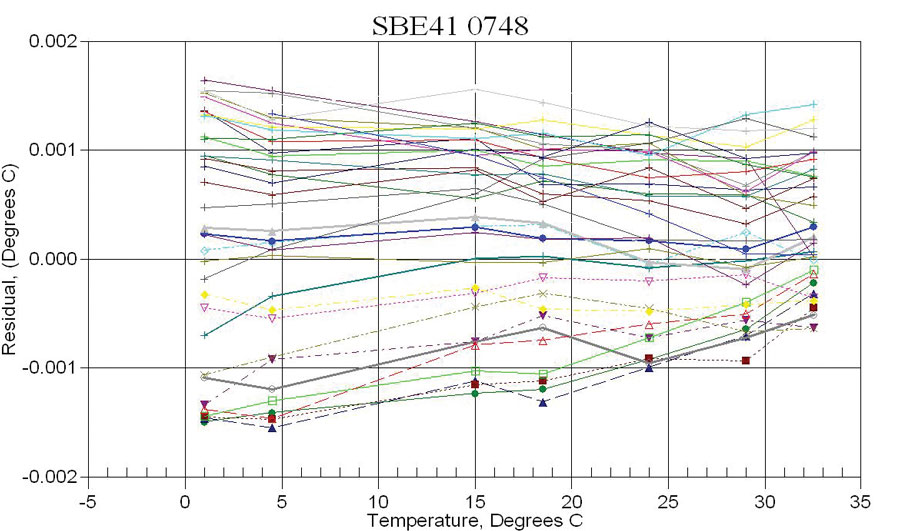
- Temperature calibrations indicate long-term drift of less than 0.002 °C and repeatability of ±0.001 °C (Figures 3 and 5).
Freezing of SBE 41 Does Not Compromise Sensor Calibration
Unique to the SBE 41 SN 0748 calibration history are the inclusion of multiple calibrations following freezing/thawing tests to simulate Arctic and Antarctic conditions.
- The float endcap was placed in 0 °C water and the entire CTD frozen on a dozen separate occasions, and held at -20 °C air temperature with 35 psu standard seawater inside the conductivity cell.
- Cells remained frozen for 16 hours, then were allowed to thaw at room temperature and recalibrated without emptying the cell.
Freezing and thawing of the conductivity cell did not impair the calibration of the sensor, and repeatability remained well within ±0.001 S/m.
The slope shown in cyan blue (14 Sep 05) resulted from evaporation of water inside the conductivity cell during storage on the shelf and subsequent coating of antifoulant over part of the sensor electrode components -- the sensor re-calibrated within 0.001 S/m (±0.005 psu) with a simple flushing with hot water.


Deployed/Recovered Argo Float CTDs -- Salinity Drift < -0.003 psu and
Temperature Drift < -0.002 °C
- Conductivity sensor post-calibrations show sensor drift < 0.001 S/m for all but one of the Argo CTDs (Figure 6).
- Residual conductivity differences indicate the difference between the CTD sensor reading based on deployment calibrations and the known calibration bath conductivities during post-calibration.
- Excluding results from SN 0933, realized salinity drift was < 0.0025 psu for all sensors deployed for 1 or more years.
- Conductivity temporal trend was low of correct by < 0.001 S/m.
- Residual temperature differences indicate the difference between the CTD sensor reading based on deployment calibrations and the known calibration bath temperatures during postcalibration.
- Temperature temporal trend was low of correct by < 0.002 °C (Figure 7).
- Four of six temperature sensors exhibit a re-calibration within 0.001 °C of production calibration, consistent with re-calibrations of sensors held in the laboratory.


Conclusions
SBE 41 and 41cp Temperature:
- Laboratory calibration drift of the temperature measurement made by the Argo SBE CTDs has a standard deviation of ±0.001 °C.
- Realized drift based on field CTD pre- and post-deployment calibrations suggest negative drift no greater than -0.002 °C over the life of the float.
SBE 41 and 41cp Conductivity:
- Laboratory calibrations of Argo SBE CTDs indicate a salinity accuracy bound of ±0.005 psu or better over several years.
- Similar results are demonstrated in the calibration history of returned Argo SBE CTD conductivity sensors.
- Five of six conductivity cells post-calibrated better than -0.0025 psu from initial deployment values.

